Intel PCM : Deep CPU Analysis for Malware Detection
LINUX
Cipherc4t
11/22/20255 min read


Introduction
When analyzing malware, traditional monitoring tools like top and htop provide only a surface-level view of system activity. They show process-level CPU utilization percentages and memory consumption, but they cannot expose what is actually happening inside the CPU itself. This is where Intel Performance Counter Monitor (PCM) comes as a solution.
PCM is a sophisticated CPU and memory monitoring tool that reads hardware performance counters built directly into modern processors.
These counters track low-level metrics that reveal the true behavior of running code—including malware. Unlike operating system-level tools, PCM sees how many instructions are executed per clock cycle, how frequently cache misses occur, and how much memory bandwidth is consumed.
This capability makes it an essential instrument for malware analysts who need to detect evasive threats that operate outside traditional detection mechanisms.
What is Intel PCM?
Intel Performance Counter Monitor (PCM) is a system performance analysis tool that provides real-time visibility into CPU and memory performance metrics. It operates by directly accessing hardware performance counters that are embedded in modern Intel processors.
Hardware Counters: The Foundation
Every modern CPU includes dozens of built-in counters that track specific events:
CPU cycles and instructions: The number of clock cycles and executable instructions processed per core
Cache performance: Hits and misses across L1, L2, and L3 cache layers
Memory bandwidth: The rate at which data moves between the CPU and RAM
Power consumption: Actual CPU power draw when supported by the processor
These counters run continuously and independently of the operating system. The OS cannot intercept or disable them, which is why PCM provides a more truthful picture of CPU behavior than standard monitoring tools.
How PCM Differs from Top and Htop
top and htop report CPU utilization percentage, calculated from the operating system's scheduler view. They answer the question: "How much of the CPU's time was this process scheduled to run?"
PCM answers a different question: "What is the CPU actually doing at the hardware level?" For example:
A process could show 80% CPU usage in top but have very low instructions-per-cycle (IPC), indicating inefficient code or deliberate CPU stalling.
Conversely, a process might show 20% CPU usage but consume significant memory bandwidth, suggesting memory-intensive operations hidden from process-level monitoring.
Why PCM Matters for Malware Analysis ?
Malware authors employ sophisticated evasion techniques to hide from OS-level monitoring. PCM bypasses these tricks by observing behavior at the CPU hardware level.
Common Malware Patterns PCM Reveals :
Cryptographic operations (ransomware, crypto-miners): These workloads execute many instructions per cycle with high cache efficiency. PCM shows consistently high instruction counts and modified IPC patterns compared to normal applications.
Memory-scraping attacks: Malware that extracts sensitive data from RAM generates excessive memory bandwidth and cache misses. Standard tools may show moderate CPU usage, but PCM reveals abnormal memory access patterns.
Packers and self-modifying code: Malware that unpacks itself or modifies code during execution produces distinctive CPU counter signatures—initially low IPC during unpacking, then behavioral shifts once code is dynamically loaded.
Kernel-mode evasion: Some malware operates in kernel space to avoid process-level detection. PCM observes these behaviors through cache and memory patterns that remain visible regardless of privilege level.
By correlating these hardware signatures with known malware behavior, analysts can detect threats that operate silently from an OS perspective.
Installing and Setting Up PCM
Step 1 : Before building PCM, ensure your system has the necessary development tools
Run : sudo apt update && sudo apt install build-essential
Step 2 : PCM is distributed as source code via GitHub. Clone the repository and build it
Run : git clone https://github.com/intel/pcm.git
cd pcm
mkdir build
cd build
Step 3 : Configure the build with CMake and compile
Run : sudo apt install cmake
cmake ..
make -j$(nproc)

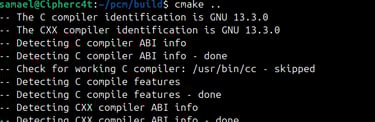
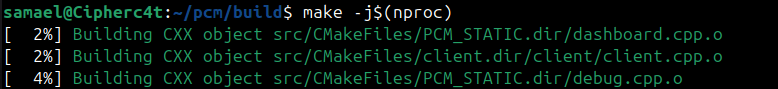
The -j$(nproc) flag parallelizes compilation across all available CPU cores, significantly speeding up the build process.
Binaries Generated
After a successful build, the build directory contains several PCM executables:
pcm.x: General-purpose CPU and core-level performance monitoring
pcm-memory.x: Memory bandwidth and NUMA (Non-Uniform Memory Access) statistics
pcm-power.x: CPU power consumption metrics
Each binary specializes in different monitoring aspects and can be used independently depending on your analysis focus.


Basic Testing 1: Baseline CPU Monitoring
Start with a simple 5-second monitoring window to observe system behavior at rest
Run : cd pcm/build/bin
sudo ./pcm 1


This command runs PCM for every 1 second and prints per-core and overall metrics. The output includes:
UTIL: CPU utilization (0–100%)
IPC: Instructions Per Cycle (higher is better CPU efficiency)
CFREQ: Core frequency in GHz
L3MISS: L3 cache misses (in thousands)
L2MISS: L2 cache misses (in thousands)
Test 2: Comparing PCM with Top
While PCM runs, open a second terminal and capture top output to compare OS-level metrics with hardware metrics:
Run : top -bn1 | head -n
Note the overall CPU% reported by top. Then compare this with PCM's UTIL and IPC numbers. You will often observe that top reports high CPU usage while IPC remains moderate, or vice versa, demonstrating the fundamental difference between OS-level and hardware-level observation.
Test 3: CPU Load on a Single Core
To observe how PCM responds to controlled CPU load, generate a busy loop on one core while monitoring with PCM.
In your second terminal, run a CPU-intensive loop for 10 seconds pinned to core 0:
Run :
taskset -c 0 bash -c 'python3 - <<PY
import time
end=time.time()+10
while time.time()<end:
x=0
for i in range(1000000):
x += i
PY'
The taskset -c 0 command restricts the Python process to core 0. This ensures all computation occurs on a single core, making the results clearly observable.
While this command runs, execute PCM in another terminal:
Run : sudo ./pcm-core 0
To Filter core 0 alone :
Run : sudo ./pcm-core 1 | grep --line-buffered "^ *0

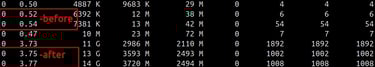
Observe that core 0's counters spike significantly:
UTIL approaches 100%
IPC may increase or remain moderate depending on the operation
Instruction counts show dramatically higher values than at baseline
This comparison clearly demonstrates PCM's ability to detect per-core activity that would appear as overall system load in traditional tools.
Limitations
You may receive this warning if secure boot is enabled while running the pcm

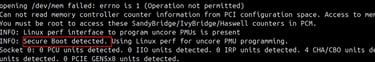
The line ,
INFO: Secure Boot detected. Using Linux perf for uncore PMU programming. clearly says the PCM is confirming that :
“I can’t access hardware registers directly. I’m switching to the perf interface instead.”
Reason : Intel PCM relies on direct access to low-level hardware registers such as /dev/mem and PCI configuration space to read uncore units, memory controllers, and bandwidth counters.
When Secure Boot is enabled, the Linux kernel enters lockdown mode, which blocks these interfaces entirely—even for root.
Conclusion
Intel PCM bridges the gap between operating system-level monitoring and actual CPU behavior. For malware analysts, this capability is critical: it enables detection of sophisticated threats that hide from traditional tools by operating at the hardware level.
By understanding PCM's metrics and practicing with the testing scenarios outlined above, you establish a foundation for identifying malicious patterns that reveal themselves only when observed through hardware performance counters.
All rights reserved © 2025 - Present MalwareHunts. For educational and research purposes only. MalwareHunts is not responsible for any misuse of the information provided.